


The Offer/Employee Ratio
A proposed measure of current market conditions that is simple and predictive.
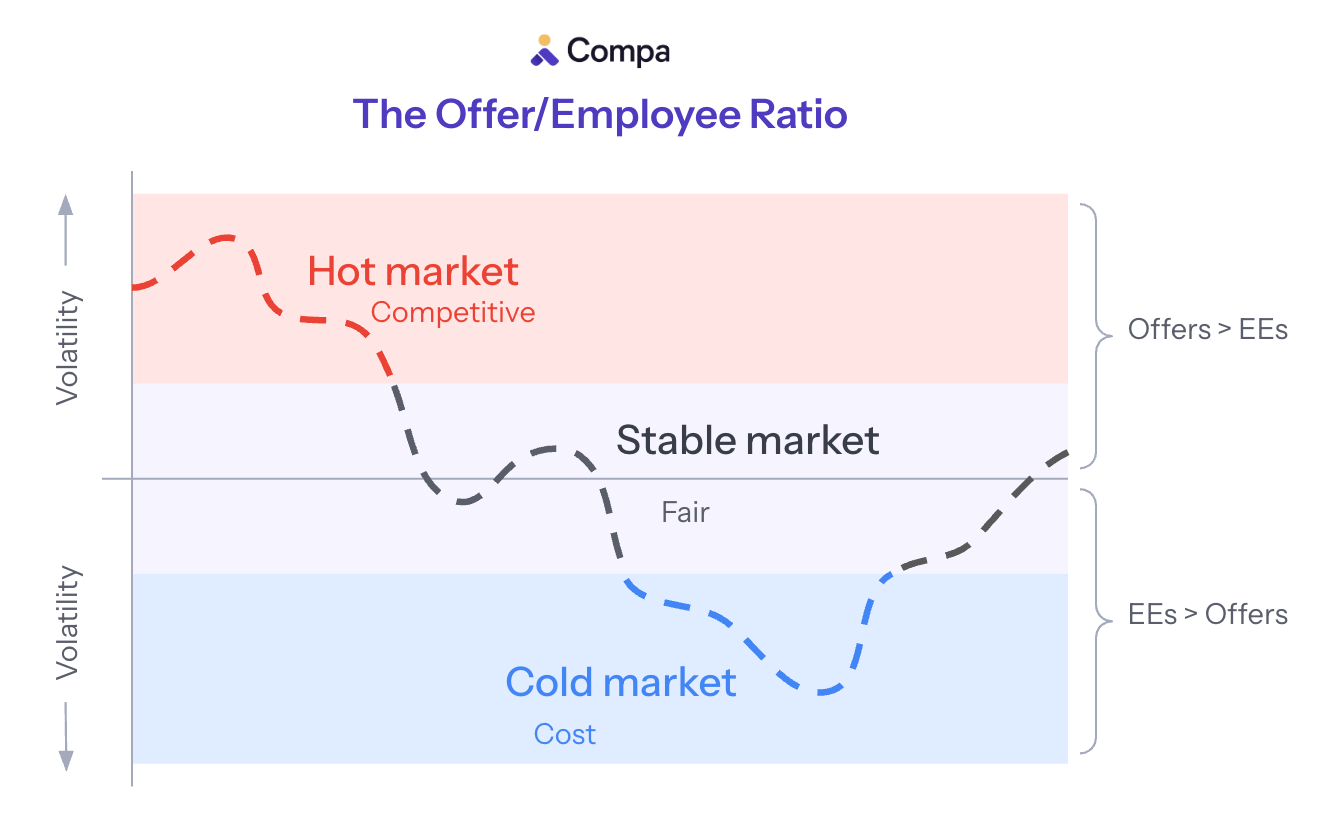
I propose looking at a simple ratio to understand current market conditions:
Offer/Employee ratio = Median offer / median employeeYou can predict market behavior with this ratio:
When offers exceed employee pay (ratio > 1.0), the market heats up, and companies focus on competition. Offer acceptance rates fall, attrition rises, exceptions grow, and the employee-friendly market drives more employee concessions like remote work and meal perks.
When offers equal employee pay (ratio ≈ 1.0), the market is stable, and companies focus on fairness. In this balanced market, compensation is more predictable, and pay equity is well-managed.
When employee pay exceeds offers (ratio < 1.0), the market cools, and companies focus on cost. Offer acceptance rates rise, attrition falls, layoffs are more likely, and the employer-friendly market drives more employer concessions, like RTO.
And to put it in a table:

Why I think an index ratio metric like this matters:
Share with my Comp Committee to set context for market conditions when we make big decisions
Understand how my own offers and employees compare — am I carrying retention risk or layoff risk?
Comp strategy is a three-legged stool between competitiveness, cost, and fairness — the ratio suggests a framework for when priorities might shift
How to measure this
It is simple to back-of-envelope calculate this.
Let’s look at a couple examples, all P4 US roles, with median offer base salary over the last 6 months compared to median employee base salary today, using Compa:
AI/ML Engineering: $241,000 / $221,000 = 1.09
Product Management: $205,000 / $200,000 = 1.03
Legal Counsel: $213,000 / $220,000 = 0.97
Now to put real weight into this, we’ll want to sharpen pencils on methodology (and remove some noise).
Compare across the same group of companies, and consider weighting: observations or companies
Account for metropolitan areas
Analyze across multiple levels, or weight job-level-metro offer/employee pairs by market volume
Consider other pay elements beyond base salary, at least target total cash
Analyze over time and consider seasonality
Another question: where is equilibrium? Is the equilibrium ratio 1.0, as I suggested, or something slightly higher than 1?
To the degree we recruit passive candidates well-employed for like-level roles, we expect to pay some non-zero switching cost, often (but not always) expressed in the form of a higher base salary.
What market are we in now?
Based on the trend data in Compa and my daily conversations with compensation leaders, I think we are in a mixed market.
The AI race is heating up offers for technical roles, but many of those same companies are hiring back from layoffs across the rest of the business at much lower costs.
But we’d have to put our Insights team to work on this to sharpen methodology and understand the market holistically. We certainly have an amazing dataset for it.
Do you think we should work on this?
Let me know your thoughts.
And excited to see you all at Compalluminati next week!
Peer Group is a newsletter for comp leaders navigating competitive talent markets! If you want to share my newsletter, you can forward this email to your colleagues and fellow comp leaders.
Want more polls and insights about the latest thinking in comp?
Subscribe by hitting the button below.
Interesting metric. One question that immediately bubbles up is how does the People org. deal with one-time dramatic moves in pay bands.
e.g. if a Company were to move up Pay Bands for Chemical Engineer by 10% (because of hot market), it wouldn't necessarily provide all incumbent employees with a 10% raise, thus ensuring that the proposed ratio would be >1 for a few comp. cycles