It's not what you know, it's who you know
Or why peer group selection is as important as market percentile
I remember presenting our comp strategy once to a room full of engineering leaders. I explained that we benchmarked to the 50th percentile.
They were not impressed.
“We hire the best engineers in the world, there’s no way we can compete by paying less than half of all companies.”
“No, no,” I explained, “we pay at the 50th percentile of the best companies in the world.” I went to the whiteboard and drew this:

The point I was making is that peer group selection completes the picture. When you say “the market,” you mean you position against a certain set of companies.
So, imagine drawing some isobars across that same graphic on how much you pay. Here’s what I think it would look like.
That is, conceptually, the 75th percentile of a median-paying company is equal to the 25th percentile of a high-paying company.
Is this true, even directionally?
Let me show you what I mean
I created three peer groups of 10 different tech companies each in Compa, each optimizing on different factors (e.g., revenue, employees, industry).
I will note that, at Compa, we generally work with market-leading enterprises who compensate well; but even within this cohort I expect to discover the powerful effects of peer group selection.
For each peer group, I looked at base salary over the last 12 months, including P25, P50, and P75. Here’s what the data look like for software engineering P4 and M3 levels, for example:

At first glance, you can clearly see that Peer Group A pays the highest, followed by B, then C.
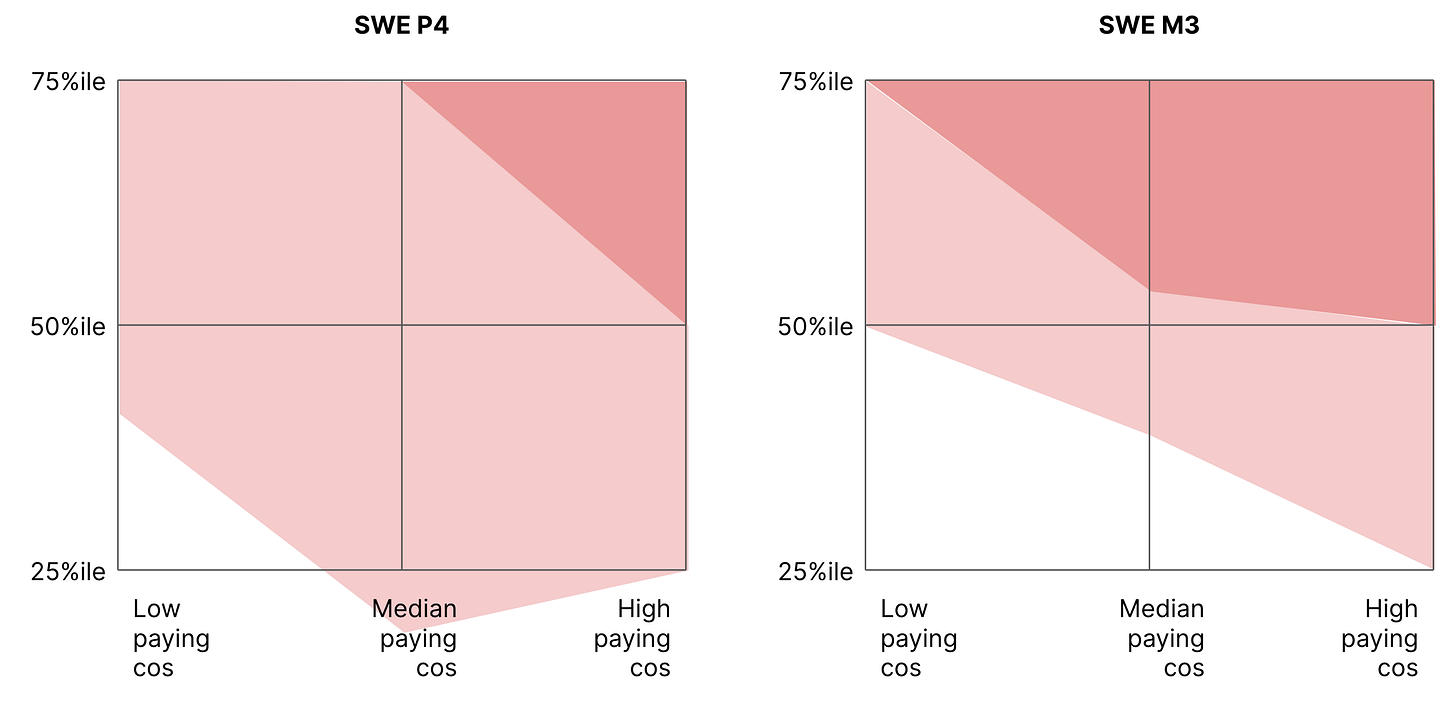
You can also visualize it on the 2x2 I drew on the whiteboard:

In both examples, you can clearly see the isobar for the 50th percentile of the high-paying companies.
For SWE P4 (left), the high-paying 50th %ile is equal to the median-paying group’s 75th %ile
For SWE M3 (right), the high-paying 50th %ile is equal to the median-paying group’s ~55th %ile and the low-paying 75th %ile
A bit of an unexpected result emerged for SWE P4: due to the tight spread in Group B, the isobar inverted for the 25th percentile of the high-paying group. So it goes in the opposite direction (but ironically still illustrates peer group sensitivity).
So what’s the point?
I’ve watched Comp Committees vigorously debate whether we should target the 60th or 65th percentile, but disinterestedly rubber-stamp peer group changes, all in the same meeting.
Percentile positioning is only a fraction of the story.
Or, put another way: it’s not just what you know, it’s who you know. 🙂
Peer Group is a newsletter for comp leaders navigating the new era of pay transparency! If you want to share my newsletter, you can forward this email to your colleagues and fellow comp leaders.
Want more polls and insights about today’s volatile talent markets?
Subscribe by hitting the button below.


