
Comp Portfolio Size and Turnover (Part 1)
The first of a 3-part series exploring the economics of compensation management

Compensation teams are like Wall Street firms managing billions in assets.
It’s not just a metaphor.
The best teams really do consider how human capital cost hits the P&L, and search for new ways to identify market changes and take advantage to help their companies win.
It’s a useful framework understand the economics of compensation management:
The size and shape of annual comp spend, your “portfolio” and the decisions to make, your “turnover”
Rationally sizing the comp team, your “management expenses”
The resulting economically inevitable adoption of AI to optimize thousands of decisions
This is the first post in a three-part series, beginning with #1: defining the size and turnover of your compensation portfolio.
And I do love a good extended metaphor — if comp teams are like Wall Street investment firms, then yes, using old data from surveys is like making trades using stock prices printed in a newspaper 12 months ago. 😉
Sizing our comp portfolio
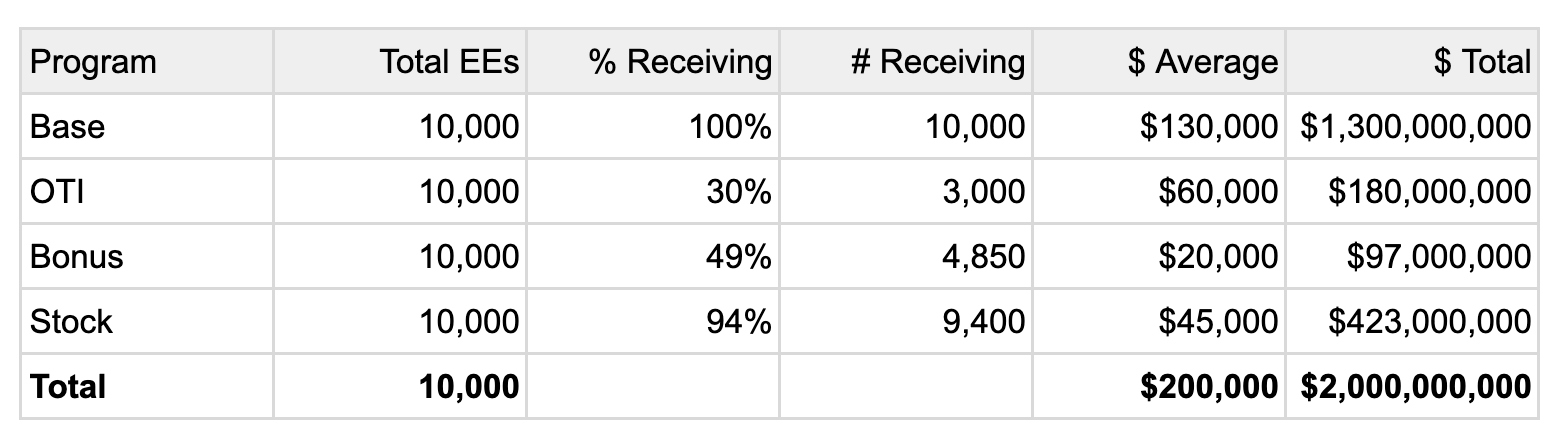
A tech company has 10,000 employees making an average of $200,000 in total direct compensation.
This company has a $2 billion compensation portfolio.
10,000 * $200,000 = $2,000,000,000 How is this $2 billion portfolio invested each year?
This tech company invests its portfolio across four compensation programs:
Base salary
Commissions
Annual bonus
Stock comp
Base salary
All 10,000 employees receive a base salary, and the global average is $130,000, for a total base salary investment of $1.3 billion.
10,000 * $130,000 = $1,300,000,000Commissions
Cash incentives are split between commissions (on-target incentives, “OTI”) and an annual bonus program.
30% of the workforce, or 3,000 employees, are commissioned with an average OTI of $60,000, for a total OTI investment of $180 million.
10,000 * 30% * $60,000 = $180,000,000Annual bonus
Of the remaining employees, about 70%, or 4,850, are eligible for the annual bonus program with an average bonus of $20,000 (~15% of base salary), for a total bonus investment of $97 million.
7,000 * ~69.3% * $20,000 = $97,000,000Stock comp
100% of employees are eligible for stock compensation, and 94% of employees receive grants each year worth an average of $45,000, for a total of $423 million. (Note we’ll break this down between new hire and refresh grants later.)
10,000 * 94% * $45,000 = $423,000,000Total compensation
Our tech company’s total $2 billion compensation portfolio is comprised of:
Calculating comp turnover
A $2 billion fund on Wall Street does not turn over its entire investment each year.
Rather, it invests a portion of the fund annually, using reserves or selling some investments to buy new ones.
Similarly, in compensation, we turn over a portion of our investment each year in the form of making pay decisions spread across each of our programs for new hire offers and current employees.
Let’s define these decisions as our annual compensation turnover.
The size of this turnover matters because it helps us estimate how big our compensation team should be.
But first, let’s calculate this tech company’s annual compensation turnover.
Offers
When looking at turnover, it’s useful to distinguish between offers and employees.
When we make offers, we turnover, or decide, 100% of the compensation package. For employee decisions, it varies based on the program.
Our tech company has a 15% hire rate, combining attrition backfills and growth, or 1,500 accepted offers with an average $200,000 total compensation package for a total of $300 million.
Base  1,500 * 100% * $130,000 = $195,000,000
OTI   1,500 *  30% *  $60,000 =  $27,000,000
Bonus 1,500 * ~49% *  $20,000 =  $14,550,000
Stock 1,500 *  94% *  $45,000 =  $63,450,000

Total                         = $300,000,000
(For simplicity, we’re assuming the same % receiving and $ averages as current employees, although this varies for most companies.)
Employees
For the remaining 8,500 employees, comp turnover varies by program:
Base salaries have a 5% pool for merit and promotions each year
OTI and bonuses are at-risk and discretionary each year, so 100% of investment turns over annually
Stock refresh grants are also at-risk and discretionary with 100% turnover annually
Putting this together, our employee turnover is ~$650 million annually.
Base   8,500 * 100% * $130,000 *   5% =  $55,250,000
OTI    8,500 *  30% *  $60,000 * 100% = $153,000,000
Bonus  8,500 * ~49% *  $20,000 * 100% =  $82,450,000
Stock  8,500 *  94% *  $45,000 * 100% = $359,550,000

Total                                 = $650,250,000
Total comp turnover
Our tech company with a $2 billion compensation portfolio makes $300 million in offer decisions and ~$650 million in employee decisions annually, for a total annual compensation turnover of ~$950 million.
This turnover is spread across each comp program:

The resulting annual compensation turnover is 47.5%.
Notice where the turnover is concentrated (and where it’s not):
Incentive pay is 74% of turnover at $700 million
Offers total 32% of turnover at $300 million
Stock comp is the most expensive program measured by turnover at $423 million
Merit cycles account for $55 million, only 6% of turnover
Why it matters
Two major insights:
The size of compensation investment, $ billions, is non-trivial to a company’s financial performance
The turnover of compensation investment is high and requires active management
Point #2 is essential to understanding the economics of compensation management.
Comparing to Wall Street, the compensation team is more like an actively-managed mutual fund than a passively-managed index fund.
This has profound implications for determining the right size of our compensation team.
And that is the next topic we’ll explore in part two of this series later this month.
Peer Group is a newsletter for comp leaders navigating competitive talent markets and AI transformation! If you want to share my newsletter, you can forward this email to your colleagues and fellow comp leaders.
Want more polls and insights about the latest thinking in comp?
Subscribe by hitting the button below.